WATER SURFACE MAPPING: METHOD SUMMARY
Here we present a summary of the MapBiomas Water Method. Access the ATBD (Algorithm Theoretical Basis Document ) in this LINK for more methodological details. .
Presentation
The main objective of MapBiomas Water is to map surface water dynamics throughout the territory of Amazonian countries (Pan-Amazon), on a monthly and annual basis from 1998 to 2024. The datasets are publicly available on a web platform to improve the management and use of water resources across the Pan-Amazon region.
The project used Landsat images from Google Earth Engine (1998–2024) to map water surfaces in Colombia. After dividing the country into 133 zones, spectral mixture analysis was applied to break down the pixels into pure components. These results were fed into a Random Forest classifier trained with MapBiomas samples. Post-classification included: masking with spectral indices (MNDWI, NDVI, AWEI, etc.), filling monthly gaps, filtering by temporal frequency, and geometric cleaning with reference layers. The results distinguish between permanent water (≥6 months/year) and seasonal water (1-5 months/year).
El mapeo comprendió el periodo de 1998 a 2024 en escala mensual, dado que a partir de 1998 la calidad de los mosaicos satelitales y por tanto de la detección de agua superficial presenta niveles óptimos para análisis rigurosos. Durante este período se procesaron y analizaron más de 396.000 escenas Landsat en la plataforma Google Earth Engine, estableciendo una base de datos robusta y confiable para el monitoreo de recursos hídricos en la región amazónica.
Organization and database
The overall coordination of MapBiomas Water is led by Imazon and RAISG, while technical and operational coordination is directed by Geokarten. The reconstruction of the monthly historical series of surface water was carried out by specialists from all biomes of the Amazonian countries, under the leadership of the following institutions: Fundación Amigos de la Naturaleza -FAN- (Bolivia), Fundación Gaia Amazonas -FGA- (Colombia), EcoCiencia (Ecuador), Instituto del Bien Común -IBC- (Perú), Provita y Wataniba (Venezuela), Alliance of Bioversity International y CIAT (Guianas y Suriname). The surface water mapping algorithm was developed by Imazon and adapted by MapBiomas Water in this initial phase of work.
The development of the MapBiomas Water control panel (dashboard) was conducted by Geodatin and includes significant contributions from the MapBiomas Water working group and platform users in the design thinking process.
Three types of products were produced by MapBiomas Water:
- Monthly and annual surface water maps;
- Surface water transition maps between “Water” and “Non-water” classes. This product was processed using the annual surface water database;
- Trend maps (increase and decrease) in surface water. This product was calculated from monthly surface water data in 5 km x 5 km grids.
The dashboard (link) consists of maps, statistics, and visualization, analysis, and data access tools. It is possible to view the data on an annual and monthly scale, as well as obtain it in different territorial units. Finally, the dashboard also provides a link to access the MapBiomas Water data API.
Method
1. Pre-processing
The process began with the acquisition of Landsat satellite images from missions 5, 7, 8, and 9, corresponding to the TM, ETM+, and OLI sensors, available on Google Earth Engine. Specifically, Collection 3 Level 1 orthorectified images with a spatial resolution of 30 metres were used. The analysis period covered 1998 to 2024, applying a filter to select only scenes with less than 70% cloud cover over Colombian territory.
2. Regionalisation
Given Colombia's size and geographical diversity, the country was divided into 133 working areas measuring 100x100 km², allowing for more efficient processing tailored to regional characteristics.
3. Spectral Mixing Analysis (SMA)
This fundamental stage allowed the subpixel composition of the images to be characterised by identifying six main components: Green Vegetation (GV), Non-Photosynthetic Vegetation (NPV), Soil, Clouds, Shade and Snow. SMA was crucial for detecting surface water mixed with other components, overcoming the limitations of whole-pixel classifiers.
4. Classification with Random Forest
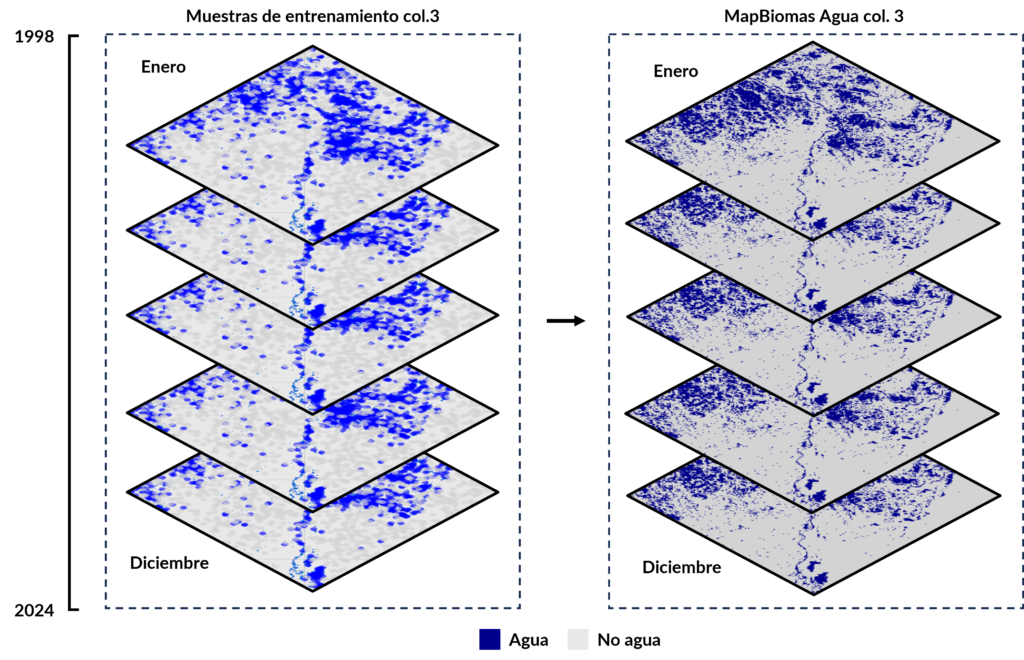
A balanced sample set was generated using the MapBiomas Agua Colombia collection as a reference, stratified by year and month, which included representative examples of both classes: "water" and "non-water".
Subsequently, the Random Forest algorithm was trained using the stratified samples, considering the regional proportion of each class. This approach ensured that the model was adapted to the specific characteristics of each area and time period.
5. Post-Classification
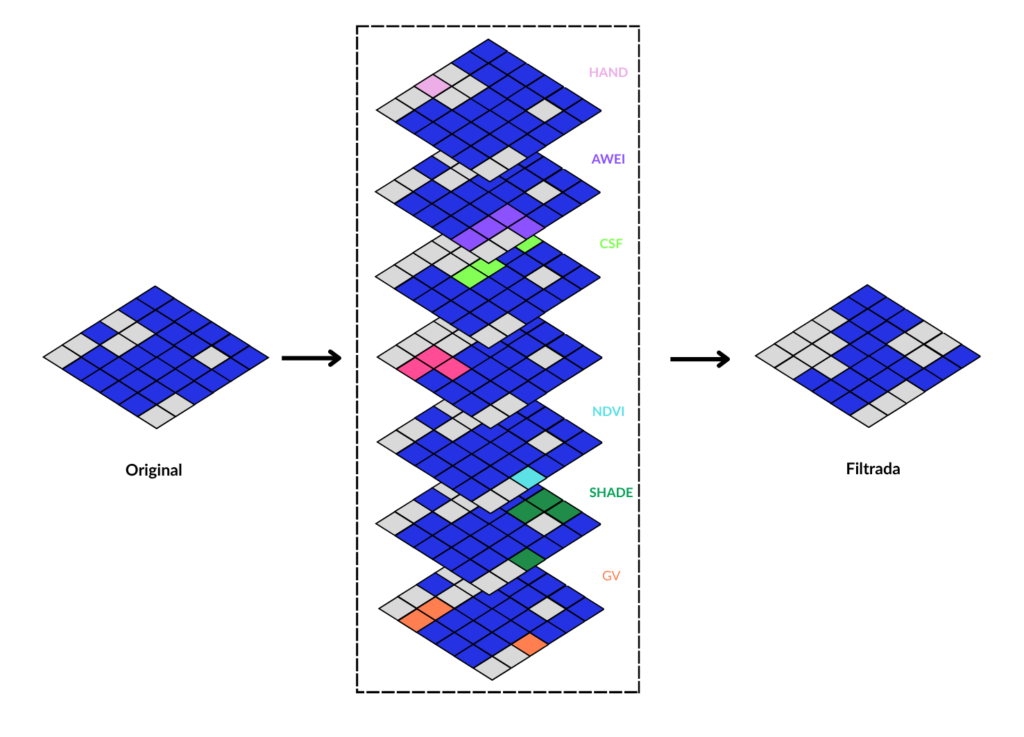
Thresholds were applied to multiple indices to refine the classification:
- MNDWI: To highlight water bodies and reduce noise from urbanised areas
- NDVI: To identify vegetation
- CSF: To reduce false positives in areas with vegetation cover
- HAND: To correlate with height relative to the nearest drainage
- AWEI: To improve classification in dark and shaded areas
- GV: For detection in wetlands and riverbanks
- SHADE: Identifies water bodies by their low reflectance spectral signature.
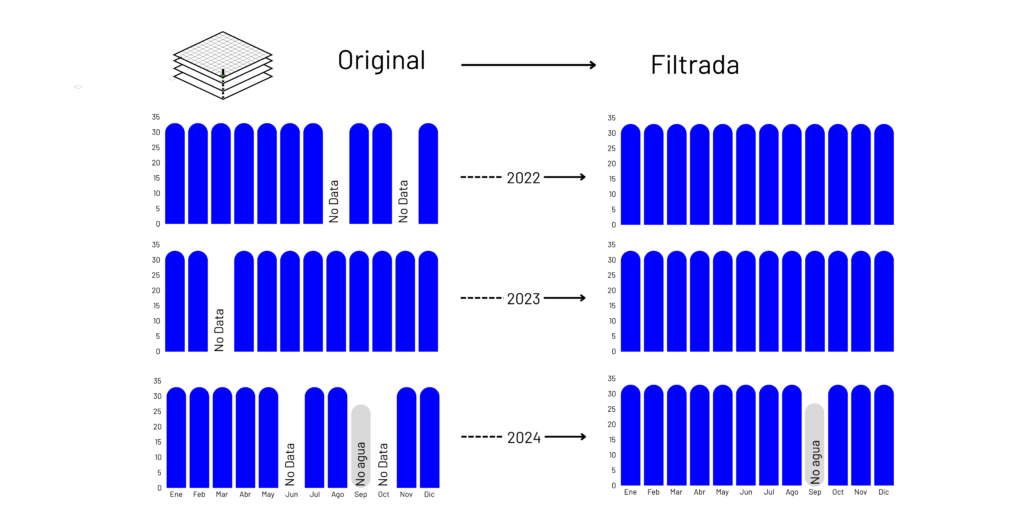
A temporary integration process was implemented to ensure continuity and consistency in the monthly series, correcting gaps or inconsistencies in detection.
Likewise, detections classified as water that showed low occurrence throughout the analysed period were eliminated, removing classification errors and atypical events that were not representative.
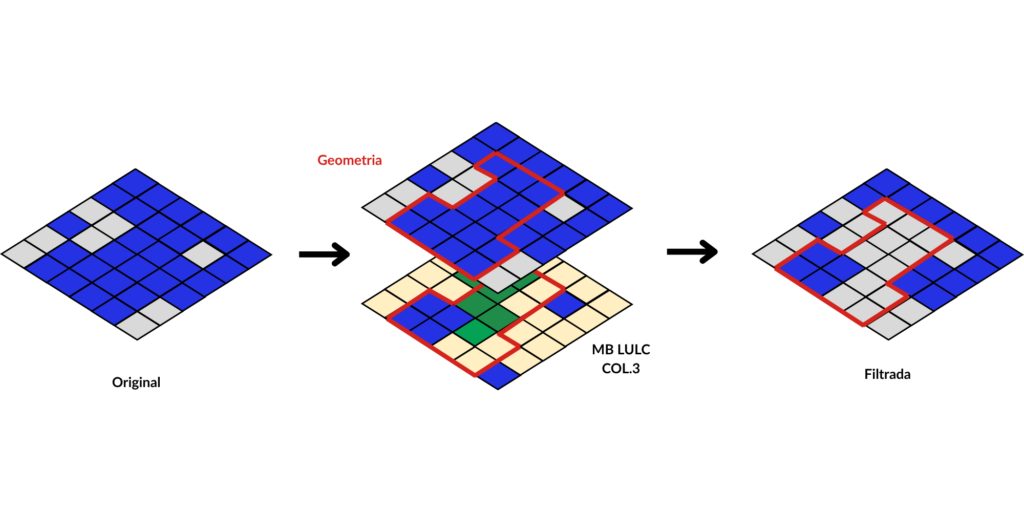
Finally, using reference layers from MapBiomas Colombia and auxiliary geometric information, spatial cleansing was performed to correct artefacts, eliminate spurious objects, and ensure that areas classified as water corresponded effectively to actual bodies of water.
6. Classification of water types
As a result, the annual maps distinguished between:
- Permanent water: present for 6 months or more per year
- Seasonal water: present for between 1 and 5 months
7. Classification of water bodies
The annual delimitation and analysis of water bodies consisted of converting monthly frequency data into vector polygons through segmentation, using Google Earth Engine's SNIC function to generate small, regular objects.
Each resulting object (segment) was assigned morphological, geomorphological and thematic properties (including area, perimeter, compactness, elongation, convexity, maximum extent, number of neighbours, land cover and land use (MapBiomas Colombia), anthropic and hydroelectric classification, SRTM height and total average frequency) in order to characterise its structure and environment.
Finally, these objects were classified using the Random Forest algorithm, using as input water bodies with a detection frequency greater than or equal to six months and a systematic set of training samples per biome, corresponding to the five naturalness classes.