GET TO KNOW THE STEPS OF THE MAPBIOMAS COLOMBIA METHODOLOGY
Here we detail the Mapbiomas Colombia methodology step by step. For each class and theme treated in the map there are specific peculiarities and characteristics that can be checked in detail in the ATBD in its appendices.
Access full methodology - ATBD
Todo comienza con imágenes del satélite Landsat, con resolución de 30 metros, disponibles de forma gratuita en la plataforma Google Earth Engine y con una serie temporal de 38 años. Se construyeron 4.446 mosaicos en todo el límite nacional, cada uno con decenas de millones de píxeles en total. Estos píxeles son las unidades de trabajo de MapBiomas. Las imágenes pueden contener nubes, bruma y otras condiciones que pueden afectar su calidad. Para producir una imagen limpia se seleccionan los píxeles despejados de las imágenes disponibles para el período seleccionado. Para cada uno de estos píxeles se extraen métricas que explican el comportamiento del píxel en ese año. Esto se hace con cada una de las 7 bandas espectrales del satélite, así como con las fracciones e índices espectrales calculados. Por ejemplo, para la Banda 1 se recoge la mediana de los valores de la banda en el período, el valor máximo, el valor mínimo en el año y la amplitud de variación. Al final, cada píxel durante un año lleva hasta 156 capas de información.

Mosaics covering the entire Colombian boundary are created for each year and are set up representing the behavior of each pixel through 156 metrics or layers of information. This mosaic set is saved as a collection of data (Asset) within the Google Earth Engine platform. These mosaics will be used in two main ways. First as source parameters for the algorithm to produce classification (see next step). It is also from this mosaic that RGB composition is derived allowing visualization of the background image in the platform MapBiomas Colombia. This composition is also used for the collection of training samples and samples for assessment of accuracy by visual interpretation.

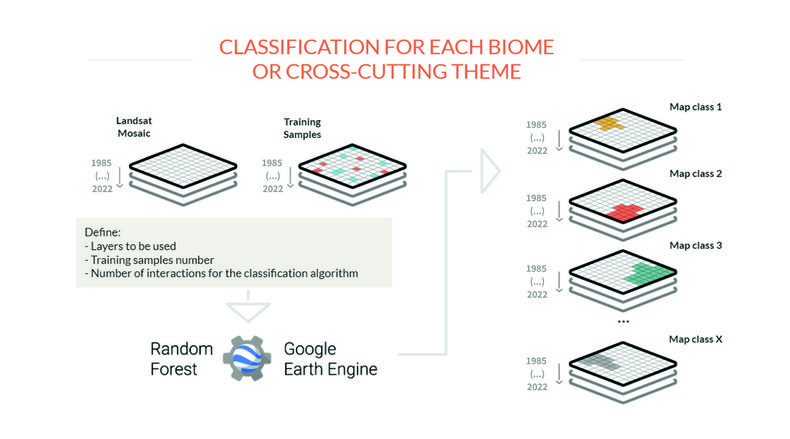
From the image mosaics, the teams of each biome and each cross-sectional theme produce a map of each land cover class (forest, urban area, etc). To do so, MapBiomas analysts use an automatic classifier called "random forest'' which runs on Google Earth Engine. This system is based on machine learning for each topic to be classified, the machines are "trained" with samples of the targets to be classified. These samples are obtained by means of reference maps generation of maps of stable classes and by direct collection by visual interpretation of the Landsat images. The classification is made for each of the years of the series and can be saved as a single map per class where each pixel has the number of layers corresponding to the number of years of the analyzed historical series.

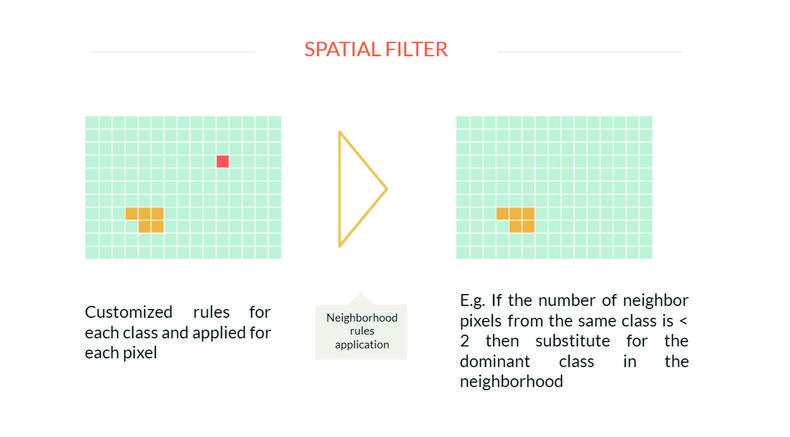
The spatial filter aims to increase the spatial consistency of the data by eliminating isolated or border pixels. Neighborhood rules are defined that can lead to a change in pixel classification. For example, a pixel that has less than two out of the nine neighboring pixels in the same class will be reclassified to the predominant class in the neighborhood. Each panel in each year and for each class of use is subjected to spatial filtering.

In order to reduce temporal inconsistencies, in particular changes in coverage and use that are impossible or not permitted (e.g. Natural Forest > Non-Forest > Natural Forest) and to correct failures due to cloud overflow or lack of data, a temporal filter is applied. Each biome, theme or region may have specific temporal filter rules. In total in Collection 4 three rules have been applied. The temporal filter is applied to each pixel analyzing all the years of the Collection (e.g. Collection 1 were 38 years).

In this step, the maps of each class are integrated into a single map, which represents the coverage and land use of each territory for each year. Prevalence rules are applied: Thus, if the same pixel is classified into two distinct class maps, it is possible to define which one belongs to the final map. The prevalence rules may vary according to the peculiarities of the biomes, themes or regions. The integration is done for each year of the series and generates an integrated map for each year usually saved as a single ASSET with the number of annual layers of the period analyzed. The integrated map goes through a further step of spatial filtering to clean the edges and loose pixels as a consequence of the integration process.

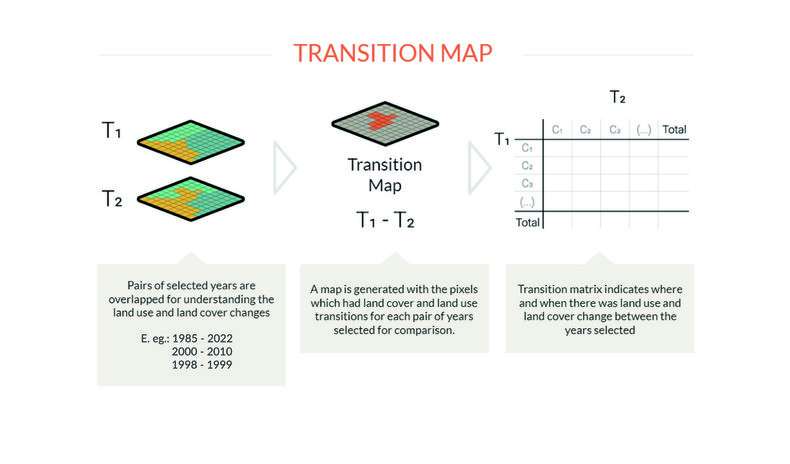
To understand changes in land cover and land use, maps are produced with class transitions between different pairs of selected years. It is thus possible to visualize the dynamism of the territory, and answer questions such as how much of the forest has turned pasture from one year to another, for example, among other changes in the landscape Transition maps are produced pixel by pixel and after finalized also pass through a spatial filter to eliminate isolated transition or border pixels. From these maps are constructed the transition matrices for each region, state, municipality and other territorial courts available on the MapBiomas Colombia platform.

