KNOW THE STEPS OF THE MAPBIOMAS COLOMBIA METHODOLOGY
Here you will find the main characteristics, the way to organize the methodological flow and a general description of the MapBiomas Colombia methodology used to generate land cover and use maps and land use transition/change maps.
You can access the ATBD (Theoretical Base Document on Algorithms) with the full description of the methodology and algorithms by accessing the link below:
DOWNLOAD THE COMPLETE METHODOLOGY - ATBD
GENERAL CHARACTERISTICS
All of MapBiomas Colombia's annual land cover and land use maps were produced from pixel-by-pixel classification of Landsat satellite images. The entire process is carried out with machine learning algorithms through the Google Earth Engine platform, which offers immense processing capabilities in the cloud. To facilitate the parameterization of the algorithms and the organization of all processing stages, a total of 47 cards and 47 path and rows are used. Each card has dimensions of 1 x 1.5 degrees (lat/long).

HOW WE ARE ORGANIZED
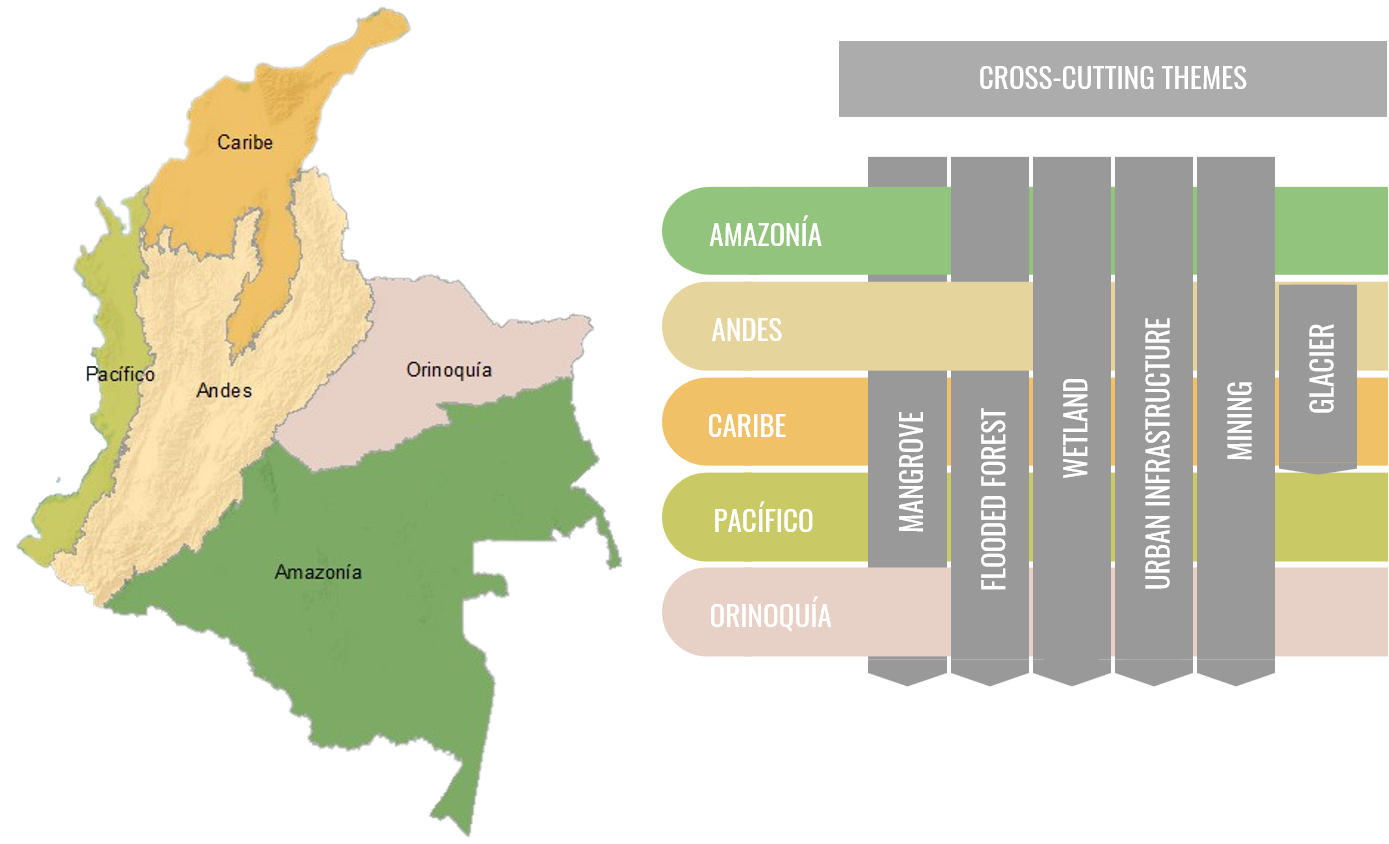
The methodological details and national categorization are organized by region (in the context of MapBiomas it corresponds to an approach to the regions of the country), and also through transversal themes that are detailed by specific methods from the perspective and technical capacity of the earth science specialists who are part of the project. You can find more details in the “About us” section.

OVERVIEW OF THE METHODOLOGY
The following diagram illustrates the main stages of the process of generating MapBiomas Colombia's annual land cover and use maps and transition maps.


